The shape of variation
One average can be correct and still describe nobody. Change a visit and watch which summaries move—and which stay calm.
Private local developmental companion · constructed values · no network execution or tracking.
In this chapter
Edit the observed values
Enter 2 to 30 nonnegative numbers separated by commas. They represent completed visits in minutes. Keep a separate ledger for unfinished waits; do not enter them as zero.
The printed example has one long wait.
Sample SD uses n−1 and is undefined for a single observation. Raw MAD is not multiplied by a normal-model calibration factor.
The tail in view
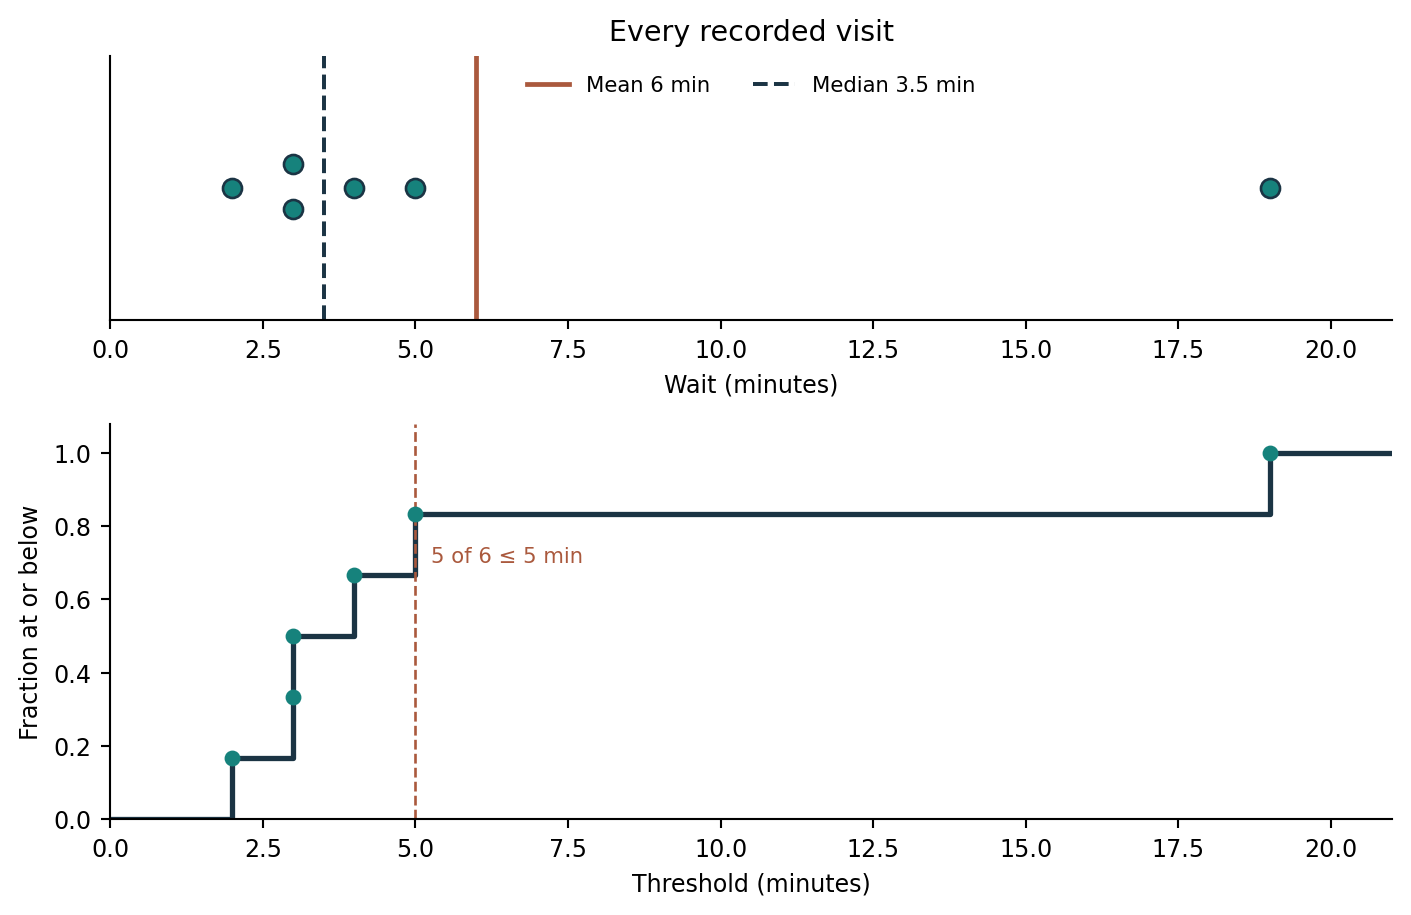
This figure is fixed at the printed six-visit case. The calculated cards above update; the image does not.
Visit or person?
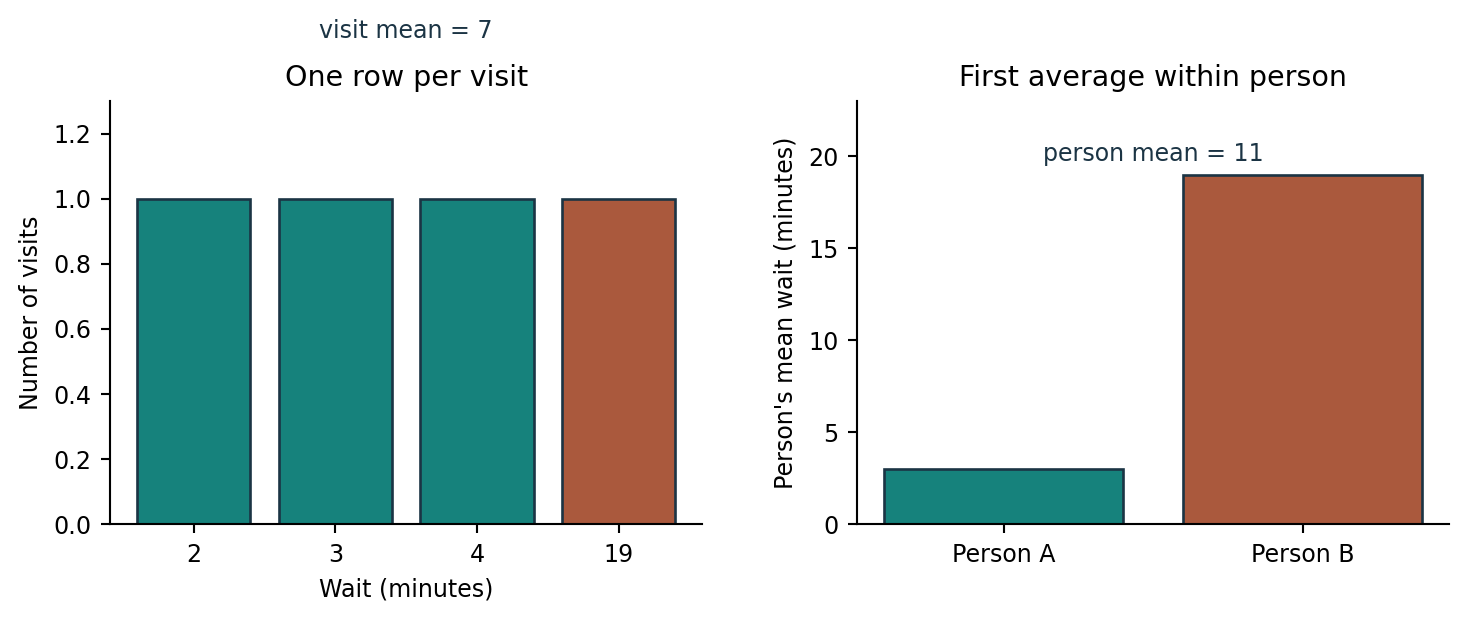
Four visits give a seven-minute visit mean. One person made the first three visits; a second made the last. Equal person weighting gives eleven.
Same mean, different experience
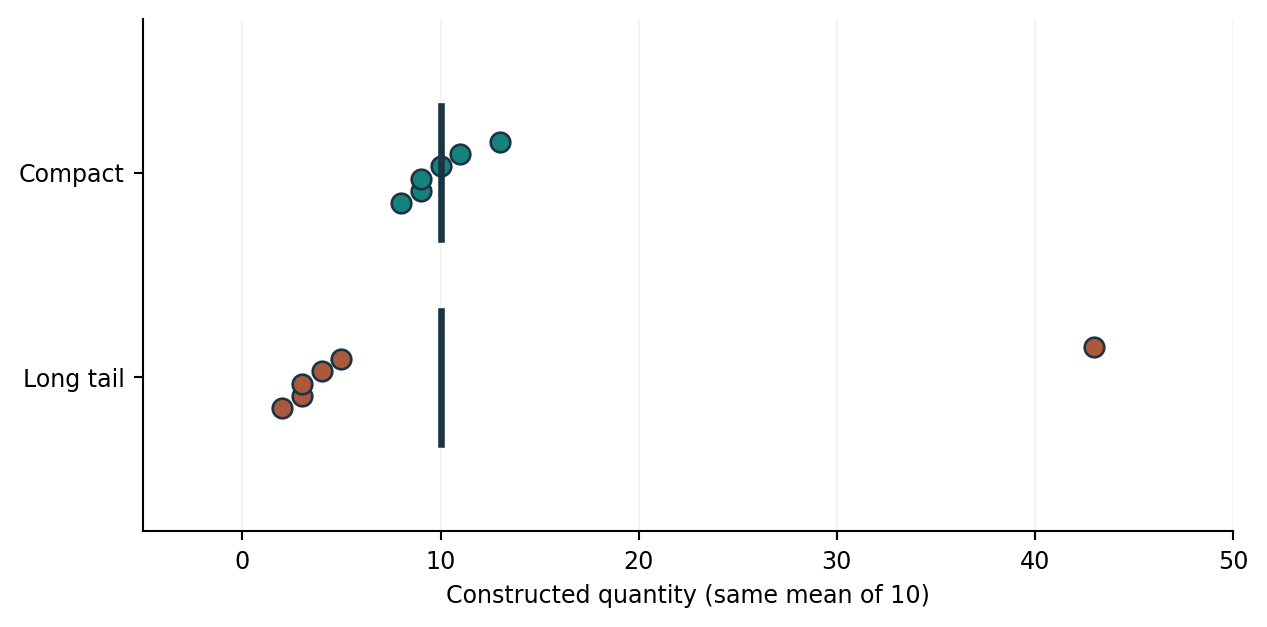
The long-tail and compact series both average ten, yet their sample variances are 262.4 and 3.2.
Move the bin edges
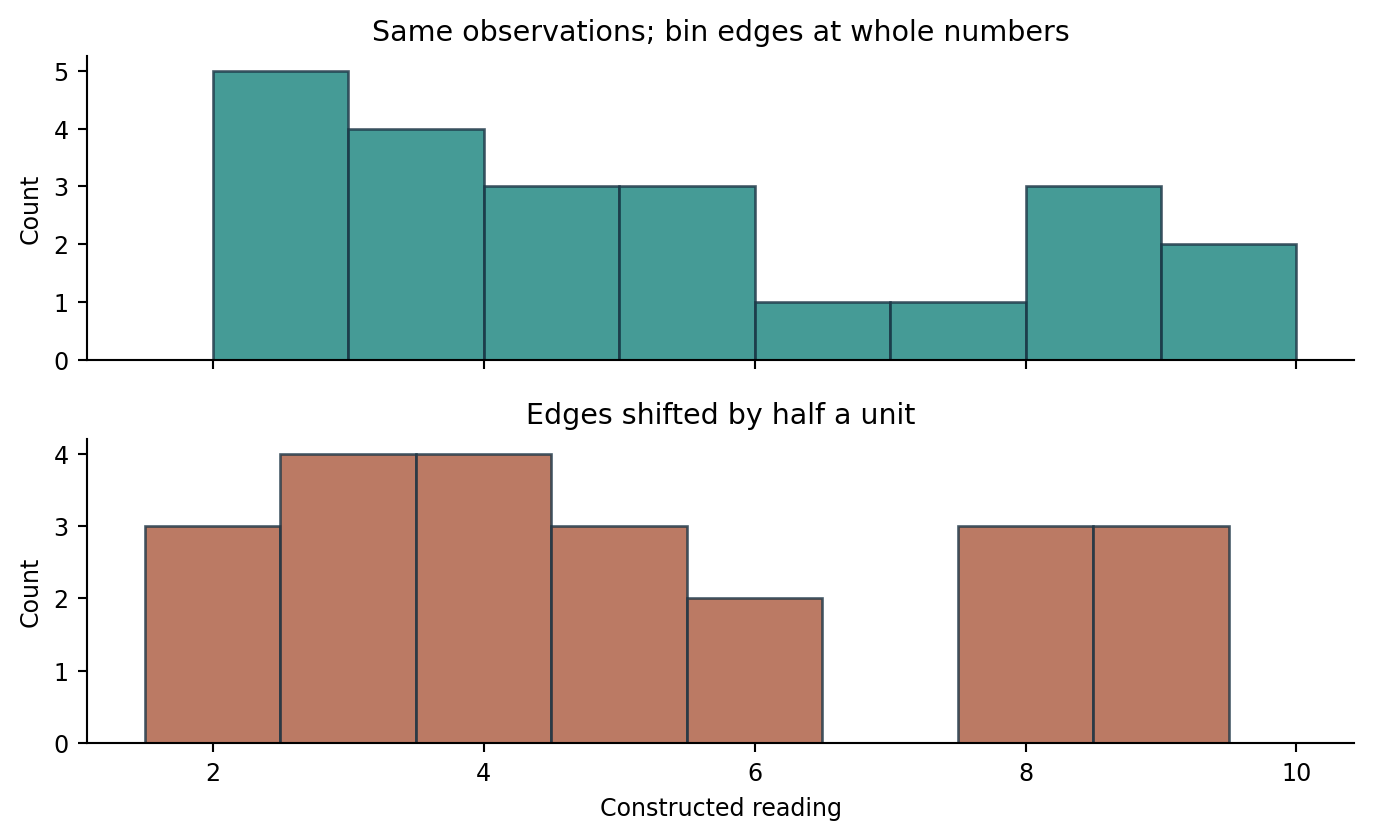
These histograms contain identical observations. A grouping that disappears when bin edges move needs further evidence.
Reproduce the chapter
Download the executed standard-library Python lab. It checks mean, median, sample variance, raw MAD, unit weighting and two percentile rules. Change the 19-minute visit to 29 and predict which summaries move.
python3 distribution_lab.py
Six visits: n=6 mean=6.0 median=3.5 mode=3
Sample variance=41.6 min^2; SD=6.45 min; raw MAD=1.0 min
Visit-weighted mean=7.0; equally person-weighted mean=11.0
All checks passed.
Why did the median stay put after one long wait grew?
The middle ordered positions stayed at three and four. The mean includes the added ten minutes in the total, so it rises by ten sixths.
Does a stable median mean the service is fine?
No. A rare long wait may matter greatly to the person who experiences it. Report a tail threshold or high percentile beside the centre.
Chapter 6 · local developmental edition. Public lab and printed QR are pending separate release approval.
Inspect the work.
Read the programs, run them in your own environment, and compare the results. The captured output records the chapter’s checked practical run; changing an input may change its answer.
Python distribution_lab.py
"""Deterministic Chapter 6 examples; no external data or packages."""
from math import sqrt
from statistics import mean, median, mode, variance

waits=[2,3,3,4,5,19]
assert sum(waits)==36
assert mean(waits)==6
assert median(waits)==3.5
assert variance(waits)==41.6
raw_mad=median([abs(x-median(waits)) for x in waits])
assert raw_mad==1
print(f"Six visits: n={len(waits)} mean={mean(waits):.1f} median={median(waits):.1f} mode={mode(waits)}")
print(f"Sample variance={variance(waits):.1f} min^2; SD={sqrt(variance(waits)):.2f} min; raw MAD={raw_mad:.1f} min")
print(f"At or below 5 min: {sum(x<=5 for x in waits)}/{len(waits)}")

compact=[8,9,9,10,11,13]
long_tail=[2,3,3,4,5,43]
assert mean(compact)==mean(long_tail)==10
assert variance(compact)==3.2
assert variance(long_tail)==262.4
print(f"Same mean 10: compact variance={variance(compact):.1f}; long-tail variance={variance(long_tail):.1f}")

visits=[2,3,4,19]
visit_mean=mean(visits)
person_mean=mean([mean(visits[:3]),mean(visits[3:])])
assert visit_mean==7 and person_mean==11
print(f"Visit-weighted mean={visit_mean:.1f}; equally person-weighted mean={person_mean:.1f}")

def quantile_nearest_rank(values,p):
    if not 0<=p<=1:raise ValueError("p outside [0,1]")
    xs=sorted(values)
    if p==0:return xs[0]
    from math import ceil
    return xs[ceil(p*len(xs))-1]

def quantile_linear(values,p):
    if not 0<=p<=1:raise ValueError("p outside [0,1]")
    xs=sorted(values);pos=(len(xs)-1)*p;lo=int(pos);hi=min(lo+1,len(xs)-1)
    return xs[lo]+(pos-lo)*(xs[hi]-xs[lo])

assert quantile_nearest_rank(waits,.75)==5
assert quantile_linear(waits,.75)==4.75
print("75th percentile: nearest-rank=5.00 min; linear interpolation=4.75 min")
print("All checks passed.")
Output Checked chapter run
Six visits: n=6 mean=6.0 median=3.5 mode=3
Sample variance=41.6 min^2; SD=6.45 min; raw MAD=1.0 min
At or below 5 min: 5/6
Same mean 10: compact variance=3.2; long-tail variance=262.4
Visit-weighted mean=7.0; equally person-weighted mean=11.0
75th percentile: nearest-rank=5.00 min; linear interpolation=4.75 min
All checks passed.