Investigation · A taller bar, a changing denominator
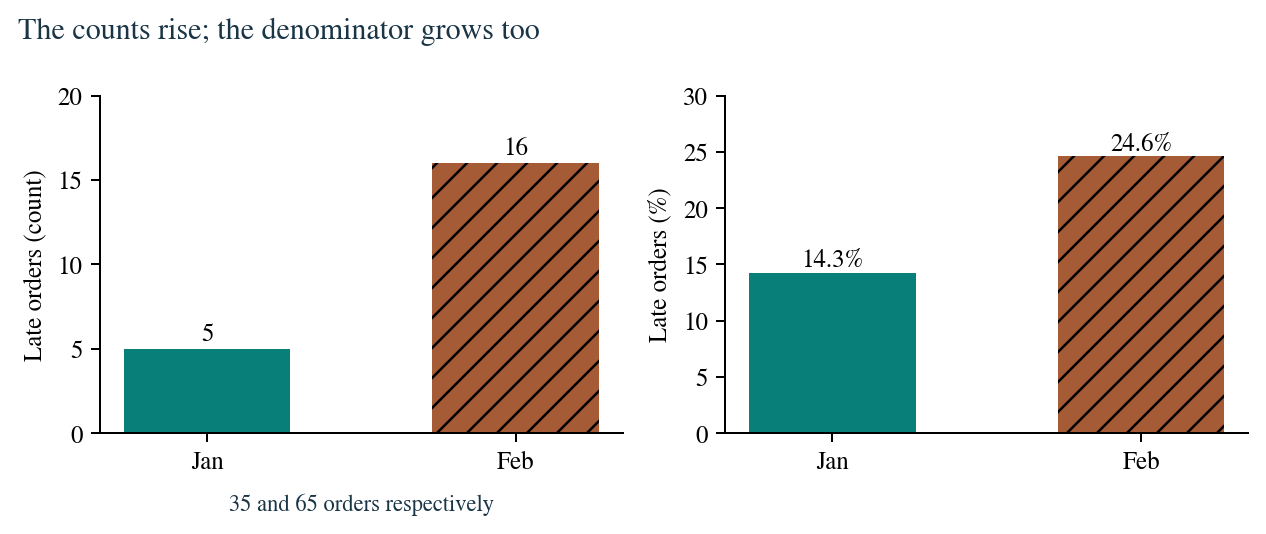
January has 5 late orders among 35. February starts with 16 among 65. Change February and write a caption that gives the count, rate and denominator.
A descriptive reversal
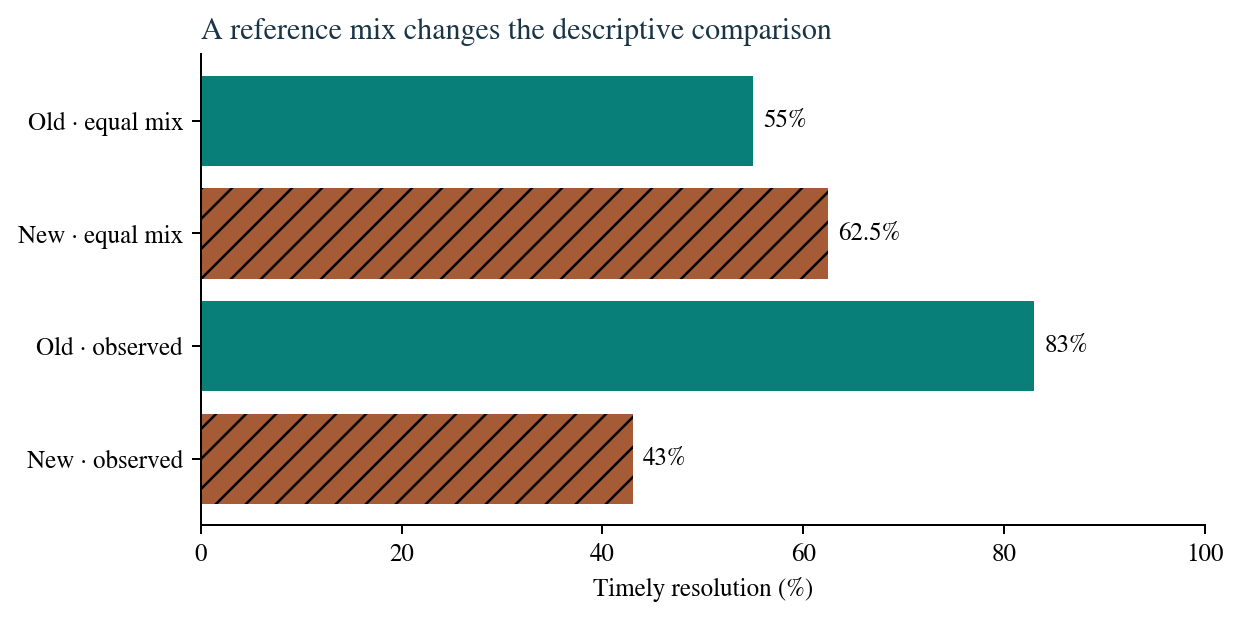
The separate constructed Cedar example has observed old/new rates of 83% and 43%. Under an equal routine/complex reference mix, the corresponding descriptive rates are 55% and 62.5%. The comparison is not a causal effect.
Reproduce and report
Download the constructed CSV, executed Python check, saved report and draft solutions. The book's exercises ask you to turn these values into a clear figure and one-page evidence note.
- Does a count bar or a rate bar answer the manager's question?
- How would you show an unobserved week without implying zero?
- What does a reviewer need to reproduce the caption?
Download the four-view plotting exercise
Inspect the work.
Read the programs, run them in your own environment, and compare the results. The captured output records the chapter’s checked practical run; changing an input may change its answer.
Python visual_report_lab.py
"""Constructed data only. Run from this directory: python3 visual_report_lab.py"""
from collections import defaultdict
from csv import DictReader
from pathlib import Path
import json

ROOT=Path(__file__).resolve().parent
with (ROOT/'dispatches.csv').open(newline='') as file:
    rows=list(DictReader(file))
assert len(rows)==6
assert len({r['Batch'] for r in rows})==6
months=defaultdict(lambda: {'orders':0,'late':0})
regions=defaultdict(lambda: {'orders':0,'late':0})
for row in rows:
    orders=int(row['Orders']);late=int(row['Late'])
    if not 0<=late<=orders or orders<=0:raise ValueError('Invalid dispatch count')
    month=row['Date'][:7]
    months[month]['orders']+=orders;months[month]['late']+=late
    regions[row['Region']]['orders']+=orders;regions[row['Region']]['late']+=late
assert dict(months)=={'2026-01':{'orders':35,'late':5},'2026-02':{'orders':65,'late':16}}
assert dict(regions)=={'North':{'orders':45,'late':8},'South':{'orders':55,'late':13}}
for item in months.values():item['rate']=item['late']/item['orders']
cedar={'old':{'routine':(81,90),'complex':(2,10)},
       'new':{'routine':(19,20),'complex':(24,80)}}
def observed(period):
    cells=cedar[period].values()
    return sum(y for y,n in cells)/sum(n for y,n in cedar[period].values())
def equal_mix(period):
    return sum(y/n for y,n in cedar[period].values())/2
assert abs(observed('old')-.83)<1e-12
assert abs(observed('new')-.43)<1e-12
assert abs(equal_mix('old')-.55)<1e-12
assert abs(equal_mix('new')-.625)<1e-12
report={'source':'constructed dispatches.csv','months':dict(months),'regions':dict(regions),
        'cedar_observed':{p:observed(p) for p in cedar},
        'cedar_equal_mix':{p:equal_mix(p) for p in cedar},
        'limits':['dispatch source coverage assumed','Cedar periods not randomised','no causal effect established']}
(ROOT/'observed_report.json').write_text(json.dumps(report,indent=2)+'\n')
print('JAN',months['2026-01'])
print('FEB',months['2026-02'])
print('CEDAR OBSERVED',report['cedar_observed'])
print('CEDAR EQUAL MIX',report['cedar_equal_mix'])
print('VISUAL REPORT CHECKS PASS')
Python four_views.py
import matplotlib.pyplot as plt

session = list(range(1, 9))
minutes = [20, 25, 30, 20, 35, 40, 30, 45]
score = [4, 5, 5, 4, 6, 7, 6, 8]
fig, axes = plt.subplots(2, 2, figsize=(7, 5.5),
                         constrained_layout=True)
axes[0, 0].plot(session, minutes, marker="o", color="black")
axes[0, 0].set(xlabel="Session order", ylabel="Study (min)",
               title="Change across sessions")
axes[0, 1].scatter(minutes, score, marker="s", color="black")
axes[0, 1].set(xlabel="Study (min)", ylabel="Score (points)",
               title="Paired observations")
axes[1, 0].bar(["A", "B"], [4, 4], color=["white", "0.5"],
               edgecolor="black")
axes[1, 0].set(xlabel="Practice group", ylabel="Sessions",
               title="Counts in two assigned groups", ylim=(0, 5))
axes[1, 1].hist(minutes, bins=[15, 25, 35, 45, 55],
                color="0.8", edgecolor="black")
axes[1, 1].set(xlabel="Study (min)", ylabel="Sessions",
               title="Distribution of recorded duration")
for axis in axes.flat:
    axis.tick_params(labelsize=8)
fig.savefig("four-views.png", dpi=300)
fig.savefig("four-views.pdf")
fig.savefig("four-views.svg")
plt.close(fig)
Output Checked chapter run
JAN {'orders': 35, 'late': 5, 'rate': 0.14285714285714285}
FEB {'orders': 65, 'late': 16, 'rate': 0.24615384615384617}
CEDAR OBSERVED {'old': 0.83, 'new': 0.43}
CEDAR EQUAL MIX {'old': 0.55, 'new': 0.625}
VISUAL REPORT CHECKS PASS